Conclusion
The results of all draws are:| Survey size | Methos | Sarkozy | Royal | Standard deviation |
| 220 | Simple Sampling | 0.52943 | 0.47057 | 0.00993 |
| 220 | Systemtic Sampling | 0.53117 | 0.46883 | 0.00731 |
| 220 | strata | 0.53112 | 0.46888 | 0.00589 |
| 500 | Simple Sampling | 0.52981 | 0.47019 | 0.00527 |
| 500 | Systemtic Sampling | 0.52948 | 0.47052 | 0.00425 |
| 500 | strata | 0.52980 | 0.47020 | 0.00346 |
We observe two phenomena that lead a better estimate of policy variables.
- The first is the number . Whatever the sampling method , the number of samples greatly improves the results. Knowing computing variance estimator of sampling without replacement is
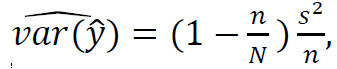 We see that over the "n" value of the number of samples increases, the variance decreases. We see a correlation between theory and practice.
 - The second is the sampling method. The simple random sampling without replacement is the easiest survey , the result is an estimate of basis for comparison . His estimate is higher than other estimates. the survey systematic sampling , we offer a better result with a practical implementation raises some question when was the result. Stratified sampling with proportional allocation of benefits lowest standard deviation between stratum alike. It is better by definition. Practice here agree well practice to theory.
No comments:
Post a Comment