Tuesday, March 11, 2014

Election night simulation


Election night simulation

Introduction

A regression estimator for scores of "Ségolène Royal and Nicolas Sarkozy" is built: we do the regression on data from the first round. One estimate 
is made from a sample of n = 220 stratified proportional allocation of the variable Strate (we do not take into account the stratification does not complicate the 
calculation of the estimator). 


Summary of the study on election night. 

We use the regression based on estimated totals. We will change 
then in proportion to the second round. 
   As in the previous study, I propose a first summary of future results 
we find later. 
   Here are the final table:


It shows a first estimate made from a stratified sampling allocation 
proportional. Then intervenes recovery that recovers the results. 
This leads to compare with the reality of elections. The results are rather good accuracy. This allows to highlight the effectiveness of recovery 
in improving the final estimate. 
In the next chapters we will dissect all the steps that were 
to achieve this result. We will study, from sampling, through regression to the final recovery. The algorithms are described one by one.


Description of the algorithms 

  Selection of polling stations stratification 


The following program remains close to the algorithm previously used by canceling the 
replication.

/* trie des données selon les strates */! 
proc sort data=tPres2007 out=tPres2007; !by Strate; !run;! 

/* echantillonage Strate sur les echantillons */! 
proc surveyselect data=tPres2007  n=220  seed=92217  out=sasPres2007 
stats;! 
Strata Strate / alloc=prop ; ! 
size exprime;/* équilibrage de la taille des strates*/! 
run;!! 

/* trie des données selon les unités de réplication et les strates */!proc 
sort data=sasPres2007 out=sasPres2007; !by Strate; !run ; 

Description of the parameters is the same as the stratified sampling with proportional allocation. 
To verify the presence of measurable bias and sampling error, we 
analyze the result of the draw by town, state, and slice of urban area.


Distribution by town 

Here are the Top 20 city:


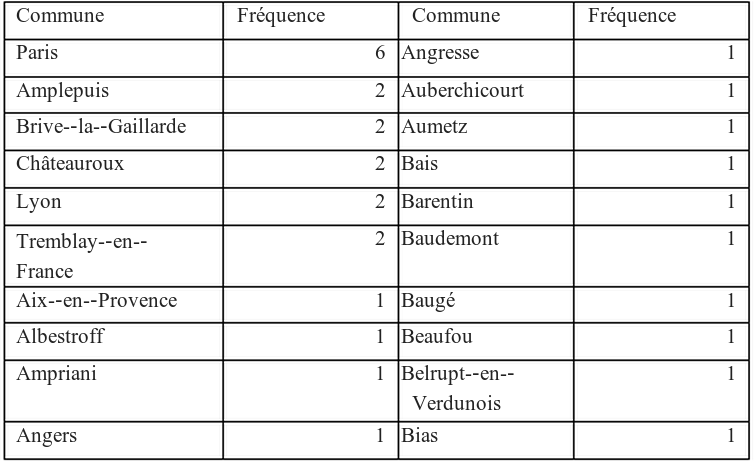
The town that is most represented in the polls is paris. selection 
reveals many common which was selected one post office. In practice it seems quite difficult, the day of the election to allocate 
offices as a separate item of the territory.


Distribution survey by department

Here are the top 30 departments


Parisian departments are strongly represented with 92, 93, 75. 
The northern department was the shot, followed by the department of Moselle. It was therefore in the north certainly chosen some twenty common. our 
drawing seems quite unbalanced in terms of this department because of extrema. this 
can be the source of a significant bias.


Distribution by Region


The island region of France is the most represented, followed by the North Pas de Calais and the Rhône Alpe. This is certainly the second position to the extreme selection 
in the department of Nord seen previously.


Distribution Slice of Urban Area


I board here shows the true proportion of urban population segments 
French. Comparing with the proportions of our samples, we note 
well enough that we meet this requirement share the same representation that allows us to reduce a number of means of sample selection.


Estimate before recovery


We estimate the total as before removing the replication setting year and adding variables to be used for recovery.
/* total Strate sur les echantillons */! 
proc surveymeans data=sasPres2007 total=65466 SUM;!    
var ROYA2 SARK2 EXPRIME2 !    
/* données pour regression */!    BAYR BESA BOVE BUFF LAGU LEPE NIHO ROYA SARK SCHI VILL VOYN abstention;!    
strata Strate;!    
weight Samplingweight;!    
ods output Statistics=estimations_sasdetail ;! 
run; 

The added variables correspond to the result of the first round candidates. 
Estimation results


Reorganization results after estimation 

We take advantage of this procedure to rename variables by prefixing their name recovery by "s".
/* transposition */! 
proc transpose data=estimations_sasdetail  out=FinalResultSas! 
label=varname;!run;! 
/* on met les résultat sur des colonnes différentes */! 
data FinalResultSas ;!  
set FinalResultSas;!  
if _NAME_='Sum' then roya=col1 ;!  
if _NAME_='Sum' then sark=col2;!  
if _NAME_='Sum' then expr=col3;!  
if _NAME_='Sum' then sBAYR=col4;!  
if _NAME_='Sum' then sBESA=col5;!  
if _NAME_='Sum' then sBOVE=col6;!  
if _NAME_='Sum' then sBUFF=col7;!  
if _NAME_='Sum' then sLAGU=col8;!  
if _NAME_='Sum' then sLEPE=col9;!  
if _NAME_='Sum' then sNIHO=col10;!  
if _NAME_='Sum' then sROYA=col11;!  
if _NAME_='Sum' then sSARK=col12;!  
if _NAME_='Sum' then sSCHI=col13;!  
if _NAME_='Sum' then sVILL=col14;!  
if _NAME_='Sum' then sVOYN=col15;!  
if _NAME_='Sum' then sabstention=col16;!!  
if _NAME_='StdDev' then errorRoya=col1 ;!  
if _NAME_='StdDev' then errorSark=col2;! 
run;! 
/* on s assure de sommer les colonnes différencié par replicate */! 
proc summary data=FinalResultSas SUM;! 
VAR roya sark expr errorRoya errorSark !sBAYR sBESA sBOVE sBUFF sLAGU 
sLEPE!sNIHO sROYA sSARK sSCHI sVILL sVOYN!sabstention ;!! 
output out=FinalResultSas  
sum(roya)=roya sum(sark)=sark sum(expr)=expr  
sum(errorRoya)=errorRoya sum(errorSark)=errorSark! 
sum(sBAYR)=sBAYR sum(sBESA)=sBESA sum(sBOVE)=sBOVE  
sum(sBUFF)=sBUFF sum(sLAGU)=sLAGU sum(sLEPE)=sLEPE! 
sum(sNIHO)=sNIHO sum(sROYA)=sROYA sum(sSARK)=sSARK  
sum(sSCHI)=sSCHI sum(sVILL)=sVILL 
sum(sVOYN)=sVOYN!sum(sabstention)=sabstention ;! 
run; 


Calculation of real total

The "summary" procedure is used to sum the results of the first round 
by candidate.

/* on calcul le total des données du premier tour */! 
proc summary data = tPres2007; ! 
var BAYR BESA BOVE BUFF LAGU LEPE NIHO ROYA SARK SCHI VILL VOYN 
abstention; ! 
output out=ProcSumOutTotal ! 
(!rename=(BAYR=tBAYR BESA=tBESA BOVE=tBOVE BUFF=tBUFF LAGU=tLAGU 
LEPE=tLEPE!NIHO=tNIHO ROYA=tROYA SARK=tSARK SCHI=tSCHI VILL=tVILL 
VOYN=tVOYN abstention=tabstention !))  
sum=; ! 
run;   

The results are:


Regression on data from the first round 

We enjoy rename regression results by prefixing the regression 
regression coefficients. By "es" for the coefficients of Sarkozy by "er" for the coefficients of Royal and "e" for the coefficients of the cast of the second round.

/* regression sur sarkozy */! 
PROC REG DATA=sasPres2007 OUTEST=estimSark!(!rename=(_TYPE_=T1 BAYR=esBAYR 
BESA=esBESA BOVE=esBOVE BUFF=esBUFF LAGU=esLAGU LEPE=esLEPE!NIHO=esNIHO 
ROYA=esROYA SARK=esSARK SCHI=esSCHI VILL=esVILL VOYN=esVOYN 
abstention=esabstention !));! 
MODEL SARK2=BAYR BESA BOVE BUFF LAGU LEPE NIHO ROYA SARK SCHI VILL VOYN 
abstention;! 
OUTPUT OUT=sortieSark ; ! 
RUN ;! 

/* regression sur royal */! 
PROC REG DATA=sasPres2007  OUTEST=estimRoya!(!rename=(_TYPE_=T2 
BAYR=erBAYR BESA=erBESA BOVE=erBOVE BUFF=erBUFF LAGU=erLAGU 
LEPE=erLEPE!NIHO=erNIHO ROYA=erROYA SARK=erSARK SCHI=erSCHI VILL=erVILL 
VOYN=erVOYN abstention=erabstention !));! 
MODEL ROYA2=BAYR BESA BOVE BUFF LAGU LEPE NIHO ROYA SARK SCHI VILL VOYN 
abstention;! 
OUTPUT OUT=sortieRoya ;! 
RUN ;! 

/* regression sur exprime */! 
PROC REG DATA=sasPres2007  OUTEST=estimExprime!(!rename=(_TYPE_=T3 
BAYR=eBAYR BESA=eBESA BOVE=eBOVE BUFF=eBUFF LAGU=eLAGU 
LEPE=eLEPE!NIHO=eNIHO ROYA=eROYA SARK=eSARK SCHI=eSCHI VILL=eVILL 
VOYN=eVOYN abstention=eabstention !));! 
MODEL EXPRIME2=BAYR BESA BOVE BUFF LAGU LEPE NIHO ROYA SARK SCHI VILL VOYN 
abstention;! 
OUTPUT OUT=sortieExprime ;! 
RUN ; 

The coefficients results are 

This regression shows three political tendencies of voters. The first trend involves people who voted BAYR, Bove, HiLo and VOYN. these 
people with obvious difficulty to choose one of two candidates in the second round. Or even less voted in the second round. 
The second trend is that of people voting for the candidate Sarkozy, we 
find all shades of the political class itself right with LEPE, SARK and VILL candidates. 
The third trend is the Royal candidate who finally meets more reps with BESA, BUFF, LAGU, Roya and SCHI. 

Abstention may benefit to candidates.


Consolidation of Results 

Filtered on interesting data for our final calculation.


data FinalResultSas (keep=Roya Sark expr!sBAYR sBESA sBOVE sBUFF sLAGU 
sLEPE!sNIHO sROYA sSARK sSCHI sVILL sVOYN!sabstention sExprime 
sVotants!tBAYR tBESA tBOVE tBUFF tLAGU tLEPE!tNIHO tROYA tSARK tSCHI tVILL 
tVOYN !tabstention texprime tvotants!eBAYR eBESA eBOVE eBUFF eLAGU 
eLEPE!eNIHO eROYA eSARK eSCHI eVILL eVOYN !eabstention !erBAYR erBESA 
erBOVE erBUFF erLAGU erLEPE!erNIHO erROYA erSARK erSCHI erVILL erVOYN 
!erabstention !esBAYR esBESA esBOVE esBUFF esLAGU esLEPE!esNIHO esROYA 
esSARK esSCHI esVILL esVOYN !esabstention !);!  
set FinalResultSas;!  
merge ProcSumOutTotal estimExprime estimRoya estimSark;! 
run; 

Adjustments and estimates of total proportions

The calculation of the regression estimation is as follows:
Where T is the actual total parameter of each of the first round (prefixed by "t"). and 
that 𝑇 (prefixed by "s") is the sample estimate of these parameters. And where β are the regression coefficients for each candidate and expressed.

/* Calcul final avec redressement */! 
data FinalResultSas;! 
set FinalResultSas;! 

/* redressement royal */ 
Roya2=Roya+erBAYR*(tBAYR-sBAYR)+erBESA*(tBESA-sBESA) +erBOVE*(tBOVE-sBOVE) 
!+erBUFF*(tBUFF-sBUFF) +erLAGU*(tLAGU-sLAGU) +erLEPE*(tLEPE-
sLEPE)!+erNIHO*(tNIHO-sNIHO) +erROYA*(tROYA-sROYA) +erSARK*(tSARK-sSARK) 
!+erSCHI*(tSCHI-sSCHI) +erVILL*(tVILL-sVILL) +erVOYN*(tVOYN-sVOYN) 
!+erabstention*(tabstention-sabstention);! 

/* Redressement Sarkozy */ 
Sark2=Sark+esBAYR*(tBAYR-sBAYR)+esBESA*(tBESA-sBESA) +esBOVE*(tBOVE-sBOVE) 
!+esBUFF*(tBUFF-sBUFF) +esLAGU*(tLAGU-sLAGU) +esLEPE*(tLEPE-
sLEPE)!+esNIHO*(tNIHO-sNIHO) +esROYA*(tROYA-sROYA) +esSARK*(tSARK-sSARK) 
!+esSCHI*(tSCHI-sSCHI) +esVILL*(tVILL-sVILL) +esVOYN*(tVOYN-sVOYN) 
!+esabstention*(tabstention-sabstention);! 

/* Redressement du nombre d’exprimés */ 
Exprime2=Expr+eBAYR*(tBAYR-sBAYR)+eBESA*(tBESA-sBESA) +eBOVE*(tBOVE-sBOVE) 
!+eBUFF*(tBUFF-sBUFF) +eLAGU*(tLAGU-sLAGU) +eLEPE*(tLEPE-
sLEPE)!+eNIHO*(tNIHO-sNIHO) +eROYA*(tROYA-sROYA) +eSARK*(tSARK-sSARK) 
!+eSCHI*(tSCHI-sSCHI) +eVILL*(tVILL-sVILL) +eVOYN*(tVOYN-sVOYN) 
!+eabstention*(tabstention-sabstention);! 

/* Calcul des proportions */ 
pctRoya=Roya/Expr;! 
pctSark=Sark/Expr;! 
pctRoyaRedresse=Roya2/Exprime2;! 
pctSarkRedresse=Sark2/Exprime2;! 
run; 

The recovery in numbers

We find here in one table all the parameters that will allow to straighten our estimator of the total. This allows us to see the error of estimate 
totals. Here we see that we have overestimated the abstention and VOYN, Roya, LEPE, LAGU, BUFF and BESA candidate. And that you overestimated VILL candidates SCHI, SARK, 
Nino, Bove and BAYR.


Results before and after adjustment

Here are the final results with their estimated values ​​then recovered.

I board added the final result to compare both the total proportions.
First, we find that the result after recovery is extremely close to the expected end result as well as a share in total .
The recovery has reduced the weight of the Candidate Royal in favor of Candidate
Sarkozy . This has also helped restore the size of the people expressed. This result is due to an excellent draw that was used to select a distribution
balanced slices urban areas of the population. It might have been more accurate if the selection was not as described in the same department .
So we see two phenomena: 

  • The choice of the polling stations and stratification.
  • The adjustment 

These two phenomena have led to a precision and the second reduction
selection bias and coverage.

Conclusion


Conclusion

The results of all draws are:

Survey sizeMethosSarkozyRoyalStandard deviation
220Simple Sampling0.529430.470570.00993
220Systemtic Sampling0.531170.468830.00731
220strata0.531120.468880.00589
500Simple Sampling0.529810.470190.00527
500Systemtic Sampling0.529480.470520.00425
500strata0.529800.470200.00346

We observe two phenomena that lead a better estimate of policy variables. 
  • The first is the number . Whatever the sampling method , the number of samples greatly improves the results. Knowing computing variance estimator of sampling without replacement is  We see that over the "n" value of the number of samples increases, the variance decreases. We see a correlation between theory and practice.  
  • The second is the sampling method. The simple random sampling without replacement is the easiest survey , the result is an estimate of basis for comparison . His estimate is higher than other estimates. the survey systematic sampling , we offer a better result with a practical implementation raises some question when was the result. Stratified sampling with proportional allocation of benefits lowest standard deviation between stratum alike. It is better by definition. Practice here agree well practice to theory.

Stratified sampling with proportional allocation

Stratified sampling with proportional allocation


Description of the algorithms


we use the same algorithms as the sampling and simple random
systematic without replacement. The difference being of course the selection of the sample. We use the same principles for calculating total and proportions to finish on
statistical evaluation of the results.

Selection algorithm

The selection algorithm is as follows (example 220 ​​samples):

/* trie des données selon les strates */
proc sort data=tPres2007 out=tPres2007;
by Strate;
run;!
/* echantillonage Strate sur les echantillons */!
proc surveyselect data=tPres2007  n=220 reps=50 seed=1213  out=sasPres2007
stats;!            Strata Strate / alloc=prop ;!            size exprime;!/* équilibrqge de la taille des strates*/
run;!
/* trie des données selon les unités de réplication et les strates */
proc sort data=sasPres2007 out=sasPres2007;
by Replicate Strate;
run ;

We use the procedure sas "SURVEYSELECT" by selecting a stratification "Strata" on the variable Strate.
The "size" parameter is used to balance the strata population size. The algorithm selects a proportional allocation units according to the size of layers with the addition of "alloc = prop" option.

We used the "rep" parameter to generate 50 replications and the seed for the random generation: 1213. This generates 50 * 220 we pooled samples in the dataset "sasPres2007."
The "stats" variable we then used to calculate the total with the procedure "Surveymean".
For this algorithm, we trillion variables before starting the procedure Strate.
Then after selecting us retrions by number of replication and Strate.
The code is identical to the print samples 500 except that "n" is 500.

Size of Strata

To know the size of the strata resulting from the procedure, we use the procedure freq following:
/* On compte les strates */!
proc freq data=sasPres2007;!
table Strate;!
by replicate;!
run;

The sample size per stratum according to this algorithm gives us 220 and 500
samples the following table.
StrateNumber of Samples for 220Number of Samples for 220
12556
22658
34399
43273
547107
647107

Calculation of total

Use the procedure "surveymean" is enhanced with a new parameter
"Strata" which defines the stratification variable.

/* total Strate sur les echantillons */!
proc surveymeans data=sasPres2007 total=65466 SUM;!  
var ROYA2 SARK2 EXPRIME2;!  
by Replicate;!  
strata Strate;!  
weight Samplingweight;!  
ods output Statistics=estimations_sasdetail ;!
run;

Example output from the first sample (first replication):
VariableTotalStandard
deviation
Royal16582766160889
Sarkozy18474255161341
Exprimed3505702092186


Results of candidates 

On 220 samples 

Comment and detailed results of Ségolène Royal


Mean = 0.46888, standard deviation = 0.00589, confidence interval 95% CI = [0.46721; 
0.47055] A similar sample and comparing the systematic sampling and random selection 
without replacement, we see better results with the effect of survey 0.59. Is here with many polling a much better accuracy. The effect of stratum 
is clear and effective.

Comment and detailed results of Nicolas Sarkozy


Mean = 0.53112, standard deviation = 0.00589, confidence interval 95% CI = [0.52945, 0.53279] 
The confidence interval is contained, more accurate and allows us to approach the true 
value of candidate Nicolas Sarkozy.

On 500 samples


Comment and detailed results of Ségolène Royal


Mean = 0.47020 
Standard deviation = 0.00346 confidence interval 95% CI = [0.46922, 0.47118] 
We are here, on the most accurate results of this first study. All survey methods used, none could give a result as interesting. 
Here, the effect of sampling is 0.65. By combining a large number of office and 
good stratification, we get the good result.

Comment and detailed results of Nicolas Sarkozy


Mean = 0.52980, standard deviation = 0.00346, confidence interval 95% CI = [0.52882; 
0.53078] 
Extremely accurate this result highlights the quality of the methodology used and the associated algorithms.


Systematic survey

Systematic survey


Description of the algorithms

We use the same algorithms as the simple random sampling without discount.
The difference being of course the selection of the sample. We use the same principles for calculating total and proportions to finish on statistical evaluation of the results.

Selection algorithm

The selection algorithm , which is close to the selection algorithm of a survey
simple random without replacement, is as follows (example 220 ​​samples):

/* echantillonage Sas sur les  echantillons */!
proc surveyselect data=tPres2007 method=SYS n=220 !                
reps=50 seed=1213  out=sasPres2007 stats;!
run;

We use the procedure sas " SURVEYSELECT " by selecting the " SYS " method. The algorithm selects the units to a fixed interval . The size of the interval is
calculated by N / n . Here the interval is : 297 . Every 297 samples , the algorithm
selected value. The starting value which is therefore between 1 and 297 is selected at random . The selection is made ​​equal probability (n / N) and without replacement.
We used the " rep " parameter to generate 50 replications and the seed for the random generation 1213.Ceci we generate 50 * 220 pooled samples in the
dataset " sasPres2007 ." The "stats" variable we used then to calculate the total with
the procedure " surveymean ." code is the same for the circulation of 500 samples with the difference that "n" is 500.

Results Of 220 samples

Comment samples and detailed results of Ségolène Royal


Mean = 0.46883, standard deviation = 0.00731 confidence interval 95% CI = [0.46675, 0.47091] 
The accuracy of this draw is immediately more accurate than simple random sampling without replacement equal size survey. 
The effect of sampling is 0.73. We won almost 26% difference - the type of the result. 

Comment and detailed results of Nicolas Sarkozy


Mean = 0.53117 
Standard deviation = 0.00731 
Confidence interval 95% CI = [0.52909, 0.53325] This draw gives Sarkozy winner 53.117%. This result is close to the final value 
53.04%. The variance is more accurate than simple random sampling with a sampling effect of nearly 73%.

On 500 samples


Comment and detailed results of Ségolène Royal


Mean = 0.47052 , standard deviation = 0.00425 , confidence interval 95% CI = [0 . 46931 ;
0.47173 ] I must say that by studying this distribution , it 's quickly see an effect
staircase is attached has the pulling method . The list of polling stations has not been sorted before the draw . We certainly face a sampling error,
cycle or not , even if it seems fairly obvious to determine. This can be a
explanation for this surprising result . A prior authorization by Slice of Urban Area certainly give us
a better result. The standard deviation here is smaller than the simple random sampling without replacement sample
equal size ( n = 500 ) .
The effect of this sample is 0.8 which is greater than that found on the sample size to 220 .
The Gaussian assumption seems compromised.

Comment and detailed results of Nicolas Sarkozy


Mean = 0.52948, standard deviation = 0.00425, confidence interval 95% CI = [0.52827; 
0.53069] can be found on the distribution, the opposite effect on the outcome of candidate Royal staircase 
down. The draw is not sorted according to a previously good distribution, we get this.


Monday, March 10, 2014

Simple random sampling without replacement

Simple random sampling without replacement

Introduction

First part describes the algorithms implemented. The selection of the sample, looking for totals and proportions, and eventually the statistical calculation. 

The second part shows the expected results for each candidate.
To calculate the average we will rely on the total so do all our calculations on total

Algorithms

The explanation of the method will be 220 ​​samples. We begin with the selection of the sample.
Then we focus on total return for our proportions and finally the calculation
the mean, standard deviation and histogram of our 50 replications

Selection of the sample

We use the procedure sas "SURVEYSELECT" by selecting the "SRS" method. This method uses an algorithm to hash Neat Floyd. the 
selection is made equal probability (n / N) and without replacement. 
Here is the code for 220 samples:

/* échantillonnage Sas sur 220 échantillons */!
proc surveyselect data=tPres2007 method=SRS n=220 reps=50 seed=1213
out=sasPres2007n220 stats;!
run;

We used the "rep" parameter to generate 50 replications and the seed for the random generation in 1213.
This generated 50 * 220 we pooled samples in the dataset "sasPres2007n220."
Each replication is identified by a column named "replicate". The "stats" variable we will then calculate the total for the procedure
"Surveymean". The code is identical to the print samples 500 except that "n" is 500.

Calculation of totals

To calculate totals, we use the method:

/* total Sas sur 220 echantillons */!
proc surveymeans data=sasPres2007 total=65466 SUM;!  
var ROYA2 SARK2 EXPRIME2;!  
by Replicate;!  
weight Samplingweight;!  
ods output Statistics=estimations_sasdetail ;!
run;

To calculate the total we use "weight" variables with sampling weights
calculate the "SURVEYSELECT" and we distinguish the total polling method.
The addition of the "total" parameter gives the total number of line "dataset" which is useful to the algorithm in the course of calculation.
We use "by" parameter to calculate the sample replication also create the variable "replicate" generated by the SURVEYSELECT procedure.

Example output from the first sample (first replication):
VariableTotalStandard
Deviation
Royal16573313777767
Sarkozy18283464807676
Expressed348567771486216

This estimator is close to 35158378 people who have actually expressed during the electoral suffrage.

Calculating proportions

To perform this simple calculation, we will launch several calls lock procedure and put the data in order.

/* transposition */! 
proc transpose data=estimations_sasdetail  out=FinalResultSasN220! 
label=varname;! by replicate;! 
run;! 
/* on met les résultat sur des colonnes différentes */! 
data FinalResultSasN220 ;!  
set FinalResultSasN220;!  
if _NAME_='Sum' then roya=col1 ;!  
if _NAME_='Sum' then sark=col2;!  
if _NAME_='Sum' then expr=col3;!  
if _NAME_='StdDev' then errorRoya=col1 ;!  
if _NAME_='StdDev' then errorSark=col2;! 
run;! 
/* on s assure de sommer les colonnes différencié par replicate */! 
proc summary data=FinalResultSasN220 SUM;! 
BY replicate;! 
VAR roya sark expr errorRoya errorSark;! 
output out=FinalResultSasN220 sum(roya)=roya sum(sark)=sark sum(expr)=expr 
sum(errorRoya)=errorRoya sum(errorSark)=errorSark;! 
run;!

/* on calcul les proportions */!
data FinalResultSasN220 ;!
set FinalResultSasN220;!
pctRoya=roya/expr ;!
pctSark=sark/expr;!
errorRoya=errorRoya/roya ;!
errorSark=errorSark/sark;!
run;!

/* on filtre les résultats */!
data FinalResultSasN220;!
set FinalResultSasN220(keep=replicate pctRoya pctSark errorRoya
errorSark);!
run;!

/* on affiche les résultats */!
proc print data=FinalResultSasN220 double;!  
var pctRoya pctSark errorRoya errorSark;!  
title 'Pct Royal et Sarkozy deuxième tour';!
run;

It goes through several transformations. The first part concerns the transposition columns results online.
We manage the results on multiple columns. With the "summary" procedure, we get a line through replication. the sums
being performed by replication on filtered and replication by single columns. we
does not really add up the results. Then we calculate the proportions of results and error candidates.
We filter for a last time to display and simplify future calculations.

Results on the proportions of 50 replications:

ObsRoyalSarkozyObsRoyalSarkozyObsRoyalSarkozy
10.475470.52453180.460460.53954350.463250.53675
20.478700.52130190.485390.51461360.470520.52948
30.493310.50669200.492800.50720370.474070.52593
40.458810.54119210.477810.52219380.466030.53397
50.477550.52245220.452190.54781390.479590.52041
60.470660.52934230.446840.55316400.474850.52515
70.462340.53766240.482390.51761410.464670.53533
80.466700.53330250.480680.51932420.473030.52697
90.459110.54089260.467110.53289430.461830.53817
100.475450.52455270.470910.52909440.459050.54095
110.450460.54954280.467300.53270450.475780.52422
120.470800.52920290.481260.51874460.480500.51950
130.479020.52098300.461580.53842470.465880.53412
140.475720.52428310.468290.53171480.483080.51692
150.463410.53659320.470710.52929490.478870.52113
160.463100.53690330.471820.52818500.460130.53987
170.473380.52662340.465660.53434

Calculate the mean, standard deviation, the confidence interval and the histogram of the results.

For this we will use the sas procedure "univariate":

/* on calcul la moyenne, ecart type, intervalle de confiance et
histogramme */!
proc univariate data=FinalResultSasN220 CIBASIC;!    var pctRoya pctSark;!
histogram pctRoya pctSark;!
run;

 The results for the 220 ​​and 500 samples will be discussed later. but their
generation has been performed with the procedure described above.

Results of candidates

On 220 samples

Comment and detailed results of Ségolène Royal


Mean = 0.47057,  difference   type = 0.00993,
Confidence interval  : IC  to  95%  =  [0.46775  ;  0.47339]
Ségolène Royal is, by evidence, a lower score to Nicolas Sarkozy. The distribution of
the result is very dense between 0.46 and 0.48. The variance is close to a percentage point, which is already accurate.
The confidence interval tells us more precisely this difference that gives us a
average between 0.46775 and 0.47339 to 95%.

Comment and detailed results of Nicolas Sarkozy


Mean = 0.52943, standard deviation = 0.00993, confidence interval 95% CI = [0.52661, 0.53225]
Nicolas Sarkozy made ​​a very good score than Ségolène Royal. The distribution of the result is very dense between 0.52 and 0.54. The variance is close to a percentage point.
The confidence interval tells us the difference between giving an average 0.52661 and
0.53225.

On 500 samples

Comment and detailed results of Ségolène Royal


Mean = 0.47019, standard deviation = 0.00527
Confidence interval 95% CI = [0.46869, 0.47169]
Ségolène Royal has a lower score to Nicolas Sarkozy. The distribution of the result is very dense between 0.4625 and 0.4775. The variance is close to half a percentage point,
which is more accurate than the sample of 220 polling stations. The confidence interval tells us the difference between giving an average 0.46869 and
0.47169.

Comment and detailed results of Nicolas Sarkozy

Mean = 0.52981 Standard deviation = 0.00527  Confidence interval 95% CI = [0.52831, 0.53131] Nicolas Sarkozy made ​​a higher score Ségolène Royal. The distribution of the result 

is dense. The variance is close to a half percentage point.