Thursday, September 25, 2014

Statistique Spatiale

Description des données

Les données de l’étude sont composées d’une variable Y ainsi que de leurs coordonnées géographiques (coordonnées : latitudes et longitudes).
Exemple de données :

X
Lat
Long
Y
1
1
-1.71355491
0.3421735
7.4554678
2
2
-2.64873033
-2.2731375
6.1101512
3
3
1.00729738
2.8770529
1.6371695
Voici la représentation graphique des points


On aperçoit des points à faible valeur sur un axe central vertical. Il existe des points plus importants sur la gauche et la droite de cet axe.

Analyse exploratoire

Analyse descriptive uni variée

Les coordonnées géographiques sont inclues dans un rectangle de point inférieur [-3.693 ,  -3.408] et de point supérieur [3.9513 , 3.948].Les données statistiques uni-variées pour la variable Y sont les suivants :
Minimum
Premier
Quartile
Médiane
Moyenne
Troisième Quartile
Maximum
Ecart type
0.2693 
2.2840
5.2990
5.6600
7.5120
14.3100
3.903863
La variable Y est centrée sur 5,66 et possède un écart type assez large de 3,9 .

Analyse des corrélations spatiales par l’indice de Moran

Pour calculer l’indice de Moran, nous utilisons la méthode « moran » du package « spdep ».
Le I de Moran dans notre exemple est de 0.2170024. Ceci permet de voir que les données ne sont pas spatialement fortement corrélées. 

Analyse des corrélations spatiales locales avec l indice local de Moran (LISA)

Les variables sont représentées sur la carte suivante :


Pour calculer l’indice local de Moran, nous utilisons la méthode « localmoran » du package « spdep ».
On aperçoit des variables fortement corrélées et d’autres non corrélées spatialement. Un certain nombre de variables sur un axe central vertical sont très corrélées entre elle. Ce diagramme corrobore bien la première analyse simple des variables dans leur environnement spatial.


Ce diagramme est un filtre basé sur la recherche des points dont la p value est inférieure à 5% et dont l’écart type dépasse l'écart type moyen. Ce sont les valeurs avec la plus forte corrélation d’indice local de moran.  
Les valeurs se trouvent sur un axe central vertical et peuvent être séparés en deux groupes distincts.

Classification

Pour la classification des données, nous utilisons la méthode « hclust » et « kmeans » du package « stats ».
Pour classifier, il nous faut définir une distance. Cette distance est simplement une mesure euclidienne composée de la distance géographique associée à la distance des valeurs Y.
distanceD3Matrix<-distanceValeur*B1+B2*distanceGeo
Avec comme valeur pour B1 et B2 :1 et 10. On insiste plus fortement sur la distance spatiale. On a choisi empiriquement ces deux valeurs.
L’utilisation de classification ascendante hiérarchique, permet de mettre en évidence la forme et la répartition des classes.


Le choix de quatre classes paraît opportun pour poursuivre cette classification.
Après une classification par kmeans basé sur le choix des quatre classes, nous obtenons la répartition géographique suivantes.  


On distingue sur cette vue géographique les quatre classes qui se répartissent géographiquement en haut, bas, gauche et droite.  Les valeurs de gauche et de droite délimitent, comme précédemment lors de l’analyse des corrélations spatiales, un axe vertical qui ici ce divise en deux classes distinctes.


Modélisation spatiale

Variogramme

Variogramme expérimental

Nous utilisons la méthode « variogram » du package « gstat ».
Nous commençons l’analyse par une analyse du variogramme.


Plus on s’éloigne du point plus la semi variance est importante. Il y a donc de forte disparité géographique.

Variogramme à 0°,45° ,90° et 135°


Le variogramme à 0° est peu variant et ressemble à un effet pépite, comparé aux autres angles qui eux ont une tendance plus importante d‘augmentation de la variance sur les distances lointaines.


Utilisation d’un model de variogramme

Pour utiliser une modélisation linéaire par krigeage, il nous faut un modèle de variogramme représentatif de nos données. Nous utilisons un modèle sphérique pour représenter nos variogrammes.


Le modèle utilisé est assez proche des quatre angles et paraît un bon compromis, atténuant fortement certains angles et en augmentant d’autres.

Krigeage sur une grille spatiale

Nous utilisons la méthode « krige » du package « gstat ».
Le résultat du krigeage est le suivant :


Comme vu lors de l’analyse exploratoire, nous avons bien un axe vertical qui se décompose en deux parties distinctes.  Les plus faibles valeurs se trouvant dans cet axe et les valeurs plus importantes sur les cotés gauche et droite. La représentation sur une grille, nous montre avec évidence la répartition de la variable Y  qui possède deux zones faiblement polluées au milieu d’autres zones très polluées.


Erreur de prédiction


On aperçoit que les erreurs de prédiction sont très importantes à droite et à gauche d ‘un axe vertical. Les erreurs sont dues au compromis fait avec notre modèle de variogramme. Il y a à gauche et à droite des valeurs fortes proches de valeurs faibles. Le modèle linéaire, lissant les valeurs, dégage ces erreurs.

Tuesday, March 11, 2014

Election night simulation


Election night simulation

Introduction

A regression estimator for scores of "Ségolène Royal and Nicolas Sarkozy" is built: we do the regression on data from the first round. One estimate 
is made from a sample of n = 220 stratified proportional allocation of the variable Strate (we do not take into account the stratification does not complicate the 
calculation of the estimator). 


Summary of the study on election night. 

We use the regression based on estimated totals. We will change 
then in proportion to the second round. 
   As in the previous study, I propose a first summary of future results 
we find later. 
   Here are the final table:


It shows a first estimate made from a stratified sampling allocation 
proportional. Then intervenes recovery that recovers the results. 
This leads to compare with the reality of elections. The results are rather good accuracy. This allows to highlight the effectiveness of recovery 
in improving the final estimate. 
In the next chapters we will dissect all the steps that were 
to achieve this result. We will study, from sampling, through regression to the final recovery. The algorithms are described one by one.


Description of the algorithms 

  Selection of polling stations stratification 


The following program remains close to the algorithm previously used by canceling the 
replication.

/* trie des données selon les strates */! 
proc sort data=tPres2007 out=tPres2007; !by Strate; !run;! 

/* echantillonage Strate sur les echantillons */! 
proc surveyselect data=tPres2007  n=220  seed=92217  out=sasPres2007 
stats;! 
Strata Strate / alloc=prop ; ! 
size exprime;/* équilibrage de la taille des strates*/! 
run;!! 

/* trie des données selon les unités de réplication et les strates */!proc 
sort data=sasPres2007 out=sasPres2007; !by Strate; !run ; 

Description of the parameters is the same as the stratified sampling with proportional allocation. 
To verify the presence of measurable bias and sampling error, we 
analyze the result of the draw by town, state, and slice of urban area.


Distribution by town 

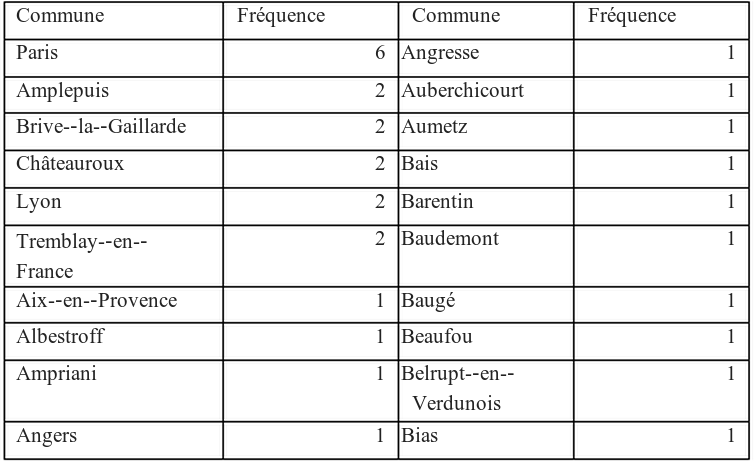
Here are the Top 20 city:


The town that is most represented in the polls is paris. selection 
reveals many common which was selected one post office. In practice it seems quite difficult, the day of the election to allocate 
offices as a separate item of the territory.


Distribution survey by department

Here are the top 30 departments


Parisian departments are strongly represented with 92, 93, 75. 
The northern department was the shot, followed by the department of Moselle. It was therefore in the north certainly chosen some twenty common. our 
drawing seems quite unbalanced in terms of this department because of extrema. this 
can be the source of a significant bias.


Distribution by Region


The island region of France is the most represented, followed by the North Pas de Calais and the Rhône Alpe. This is certainly the second position to the extreme selection 
in the department of Nord seen previously.


Distribution Slice of Urban Area


I board here shows the true proportion of urban population segments 
French. Comparing with the proportions of our samples, we note 
well enough that we meet this requirement share the same representation that allows us to reduce a number of means of sample selection.


Estimate before recovery


We estimate the total as before removing the replication setting year and adding variables to be used for recovery.
/* total Strate sur les echantillons */! 
proc surveymeans data=sasPres2007 total=65466 SUM;!    
var ROYA2 SARK2 EXPRIME2 !    
/* données pour regression */!    BAYR BESA BOVE BUFF LAGU LEPE NIHO ROYA SARK SCHI VILL VOYN abstention;!    
strata Strate;!    
weight Samplingweight;!    
ods output Statistics=estimations_sasdetail ;! 
run; 

The added variables correspond to the result of the first round candidates. 
Estimation results


Reorganization results after estimation 

We take advantage of this procedure to rename variables by prefixing their name recovery by "s".
/* transposition */! 
proc transpose data=estimations_sasdetail  out=FinalResultSas! 
label=varname;!run;! 
/* on met les résultat sur des colonnes différentes */! 
data FinalResultSas ;!  
set FinalResultSas;!  
if _NAME_='Sum' then roya=col1 ;!  
if _NAME_='Sum' then sark=col2;!  
if _NAME_='Sum' then expr=col3;!  
if _NAME_='Sum' then sBAYR=col4;!  
if _NAME_='Sum' then sBESA=col5;!  
if _NAME_='Sum' then sBOVE=col6;!  
if _NAME_='Sum' then sBUFF=col7;!  
if _NAME_='Sum' then sLAGU=col8;!  
if _NAME_='Sum' then sLEPE=col9;!  
if _NAME_='Sum' then sNIHO=col10;!  
if _NAME_='Sum' then sROYA=col11;!  
if _NAME_='Sum' then sSARK=col12;!  
if _NAME_='Sum' then sSCHI=col13;!  
if _NAME_='Sum' then sVILL=col14;!  
if _NAME_='Sum' then sVOYN=col15;!  
if _NAME_='Sum' then sabstention=col16;!!  
if _NAME_='StdDev' then errorRoya=col1 ;!  
if _NAME_='StdDev' then errorSark=col2;! 
run;! 
/* on s assure de sommer les colonnes différencié par replicate */! 
proc summary data=FinalResultSas SUM;! 
VAR roya sark expr errorRoya errorSark !sBAYR sBESA sBOVE sBUFF sLAGU 
sLEPE!sNIHO sROYA sSARK sSCHI sVILL sVOYN!sabstention ;!! 
output out=FinalResultSas  
sum(roya)=roya sum(sark)=sark sum(expr)=expr  
sum(errorRoya)=errorRoya sum(errorSark)=errorSark! 
sum(sBAYR)=sBAYR sum(sBESA)=sBESA sum(sBOVE)=sBOVE  
sum(sBUFF)=sBUFF sum(sLAGU)=sLAGU sum(sLEPE)=sLEPE! 
sum(sNIHO)=sNIHO sum(sROYA)=sROYA sum(sSARK)=sSARK  
sum(sSCHI)=sSCHI sum(sVILL)=sVILL 
sum(sVOYN)=sVOYN!sum(sabstention)=sabstention ;! 
run; 


Calculation of real total

The "summary" procedure is used to sum the results of the first round 
by candidate.

/* on calcul le total des données du premier tour */! 
proc summary data = tPres2007; ! 
var BAYR BESA BOVE BUFF LAGU LEPE NIHO ROYA SARK SCHI VILL VOYN 
abstention; ! 
output out=ProcSumOutTotal ! 
(!rename=(BAYR=tBAYR BESA=tBESA BOVE=tBOVE BUFF=tBUFF LAGU=tLAGU 
LEPE=tLEPE!NIHO=tNIHO ROYA=tROYA SARK=tSARK SCHI=tSCHI VILL=tVILL 
VOYN=tVOYN abstention=tabstention !))  
sum=; ! 
run;   

The results are:


Regression on data from the first round 

We enjoy rename regression results by prefixing the regression 
regression coefficients. By "es" for the coefficients of Sarkozy by "er" for the coefficients of Royal and "e" for the coefficients of the cast of the second round.

/* regression sur sarkozy */! 
PROC REG DATA=sasPres2007 OUTEST=estimSark!(!rename=(_TYPE_=T1 BAYR=esBAYR 
BESA=esBESA BOVE=esBOVE BUFF=esBUFF LAGU=esLAGU LEPE=esLEPE!NIHO=esNIHO 
ROYA=esROYA SARK=esSARK SCHI=esSCHI VILL=esVILL VOYN=esVOYN 
abstention=esabstention !));! 
MODEL SARK2=BAYR BESA BOVE BUFF LAGU LEPE NIHO ROYA SARK SCHI VILL VOYN 
abstention;! 
OUTPUT OUT=sortieSark ; ! 
RUN ;! 

/* regression sur royal */! 
PROC REG DATA=sasPres2007  OUTEST=estimRoya!(!rename=(_TYPE_=T2 
BAYR=erBAYR BESA=erBESA BOVE=erBOVE BUFF=erBUFF LAGU=erLAGU 
LEPE=erLEPE!NIHO=erNIHO ROYA=erROYA SARK=erSARK SCHI=erSCHI VILL=erVILL 
VOYN=erVOYN abstention=erabstention !));! 
MODEL ROYA2=BAYR BESA BOVE BUFF LAGU LEPE NIHO ROYA SARK SCHI VILL VOYN 
abstention;! 
OUTPUT OUT=sortieRoya ;! 
RUN ;! 

/* regression sur exprime */! 
PROC REG DATA=sasPres2007  OUTEST=estimExprime!(!rename=(_TYPE_=T3 
BAYR=eBAYR BESA=eBESA BOVE=eBOVE BUFF=eBUFF LAGU=eLAGU 
LEPE=eLEPE!NIHO=eNIHO ROYA=eROYA SARK=eSARK SCHI=eSCHI VILL=eVILL 
VOYN=eVOYN abstention=eabstention !));! 
MODEL EXPRIME2=BAYR BESA BOVE BUFF LAGU LEPE NIHO ROYA SARK SCHI VILL VOYN 
abstention;! 
OUTPUT OUT=sortieExprime ;! 
RUN ; 

The coefficients results are 

This regression shows three political tendencies of voters. The first trend involves people who voted BAYR, Bove, HiLo and VOYN. these 
people with obvious difficulty to choose one of two candidates in the second round. Or even less voted in the second round. 
The second trend is that of people voting for the candidate Sarkozy, we 
find all shades of the political class itself right with LEPE, SARK and VILL candidates. 
The third trend is the Royal candidate who finally meets more reps with BESA, BUFF, LAGU, Roya and SCHI. 

Abstention may benefit to candidates.


Consolidation of Results 

Filtered on interesting data for our final calculation.


data FinalResultSas (keep=Roya Sark expr!sBAYR sBESA sBOVE sBUFF sLAGU 
sLEPE!sNIHO sROYA sSARK sSCHI sVILL sVOYN!sabstention sExprime 
sVotants!tBAYR tBESA tBOVE tBUFF tLAGU tLEPE!tNIHO tROYA tSARK tSCHI tVILL 
tVOYN !tabstention texprime tvotants!eBAYR eBESA eBOVE eBUFF eLAGU 
eLEPE!eNIHO eROYA eSARK eSCHI eVILL eVOYN !eabstention !erBAYR erBESA 
erBOVE erBUFF erLAGU erLEPE!erNIHO erROYA erSARK erSCHI erVILL erVOYN 
!erabstention !esBAYR esBESA esBOVE esBUFF esLAGU esLEPE!esNIHO esROYA 
esSARK esSCHI esVILL esVOYN !esabstention !);!  
set FinalResultSas;!  
merge ProcSumOutTotal estimExprime estimRoya estimSark;! 
run; 

Adjustments and estimates of total proportions

The calculation of the regression estimation is as follows:
Where T is the actual total parameter of each of the first round (prefixed by "t"). and 
that 𝑇 (prefixed by "s") is the sample estimate of these parameters. And where β are the regression coefficients for each candidate and expressed.

/* Calcul final avec redressement */! 
data FinalResultSas;! 
set FinalResultSas;! 

/* redressement royal */ 
Roya2=Roya+erBAYR*(tBAYR-sBAYR)+erBESA*(tBESA-sBESA) +erBOVE*(tBOVE-sBOVE) 
!+erBUFF*(tBUFF-sBUFF) +erLAGU*(tLAGU-sLAGU) +erLEPE*(tLEPE-
sLEPE)!+erNIHO*(tNIHO-sNIHO) +erROYA*(tROYA-sROYA) +erSARK*(tSARK-sSARK) 
!+erSCHI*(tSCHI-sSCHI) +erVILL*(tVILL-sVILL) +erVOYN*(tVOYN-sVOYN) 
!+erabstention*(tabstention-sabstention);! 

/* Redressement Sarkozy */ 
Sark2=Sark+esBAYR*(tBAYR-sBAYR)+esBESA*(tBESA-sBESA) +esBOVE*(tBOVE-sBOVE) 
!+esBUFF*(tBUFF-sBUFF) +esLAGU*(tLAGU-sLAGU) +esLEPE*(tLEPE-
sLEPE)!+esNIHO*(tNIHO-sNIHO) +esROYA*(tROYA-sROYA) +esSARK*(tSARK-sSARK) 
!+esSCHI*(tSCHI-sSCHI) +esVILL*(tVILL-sVILL) +esVOYN*(tVOYN-sVOYN) 
!+esabstention*(tabstention-sabstention);! 

/* Redressement du nombre d’exprimés */ 
Exprime2=Expr+eBAYR*(tBAYR-sBAYR)+eBESA*(tBESA-sBESA) +eBOVE*(tBOVE-sBOVE) 
!+eBUFF*(tBUFF-sBUFF) +eLAGU*(tLAGU-sLAGU) +eLEPE*(tLEPE-
sLEPE)!+eNIHO*(tNIHO-sNIHO) +eROYA*(tROYA-sROYA) +eSARK*(tSARK-sSARK) 
!+eSCHI*(tSCHI-sSCHI) +eVILL*(tVILL-sVILL) +eVOYN*(tVOYN-sVOYN) 
!+eabstention*(tabstention-sabstention);! 

/* Calcul des proportions */ 
pctRoya=Roya/Expr;! 
pctSark=Sark/Expr;! 
pctRoyaRedresse=Roya2/Exprime2;! 
pctSarkRedresse=Sark2/Exprime2;! 
run; 

The recovery in numbers

We find here in one table all the parameters that will allow to straighten our estimator of the total. This allows us to see the error of estimate 
totals. Here we see that we have overestimated the abstention and VOYN, Roya, LEPE, LAGU, BUFF and BESA candidate. And that you overestimated VILL candidates SCHI, SARK, 
Nino, Bove and BAYR.


Results before and after adjustment

Here are the final results with their estimated values ​​then recovered.

I board added the final result to compare both the total proportions.
First, we find that the result after recovery is extremely close to the expected end result as well as a share in total .
The recovery has reduced the weight of the Candidate Royal in favor of Candidate
Sarkozy . This has also helped restore the size of the people expressed. This result is due to an excellent draw that was used to select a distribution
balanced slices urban areas of the population. It might have been more accurate if the selection was not as described in the same department .
So we see two phenomena: 

  • The choice of the polling stations and stratification.
  • The adjustment 

These two phenomena have led to a precision and the second reduction
selection bias and coverage.

Conclusion


Conclusion

The results of all draws are:

Survey sizeMethosSarkozyRoyalStandard deviation
220Simple Sampling0.529430.470570.00993
220Systemtic Sampling0.531170.468830.00731
220strata0.531120.468880.00589
500Simple Sampling0.529810.470190.00527
500Systemtic Sampling0.529480.470520.00425
500strata0.529800.470200.00346

We observe two phenomena that lead a better estimate of policy variables. 
  • The first is the number . Whatever the sampling method , the number of samples greatly improves the results. Knowing computing variance estimator of sampling without replacement is  We see that over the "n" value of the number of samples increases, the variance decreases. We see a correlation between theory and practice.  
  • The second is the sampling method. The simple random sampling without replacement is the easiest survey , the result is an estimate of basis for comparison . His estimate is higher than other estimates. the survey systematic sampling , we offer a better result with a practical implementation raises some question when was the result. Stratified sampling with proportional allocation of benefits lowest standard deviation between stratum alike. It is better by definition. Practice here agree well practice to theory.